One of the common tasks at autopsy is estimation of the degree of atherosclerotic stenosis of the coronary arteries. Most of the time it’s done in passing — nobody really cares if a person who’s been shot in the head has bad coronary arteries. So, most of the time it’s good enough to say “There is diffuse mild atherosclerotic stenosis of the coronary arteries.” And, sometimes, it’s good enough to say “There is severe diffuse atherosclerotic disease with greater than 95% percent stenosis of the left anterior descending coronary artery.”
So, most of the time I eyeball it. And I’ll say that by dictating something like “There is approximately 60% atherosclerotic stenosis of the right coronary artery by visual estimation.” But, sometimes all you have is coronary artery disease in a sudden death, and it’s right at that 75% threshold that many of us use for feeling good about calling sudden cardiac death. In those cases, I try to measure the atherosclerosis a bit more carefully.
So, I take a section and do a little morphometry. This is how I do it.
- Take a section (Doh!). This can be more challenging that one might think. If it’s calcified, then it might crumble. Unfortunately, with the workload of today’s job situation, I really don’t want to spend a day decalcifying it. So, in those cases, I’ll just eyeball it and there you go. I usually don’t bother to make a gross photo, since macro photography can be a hassle. It’s all a matter of how much time I have and how busy the day is… So– people have to take my word for it. Also, if your blade isn’t sharp, you can push the plaque right out of the artery. I’ve done that. But, if you can get a section…
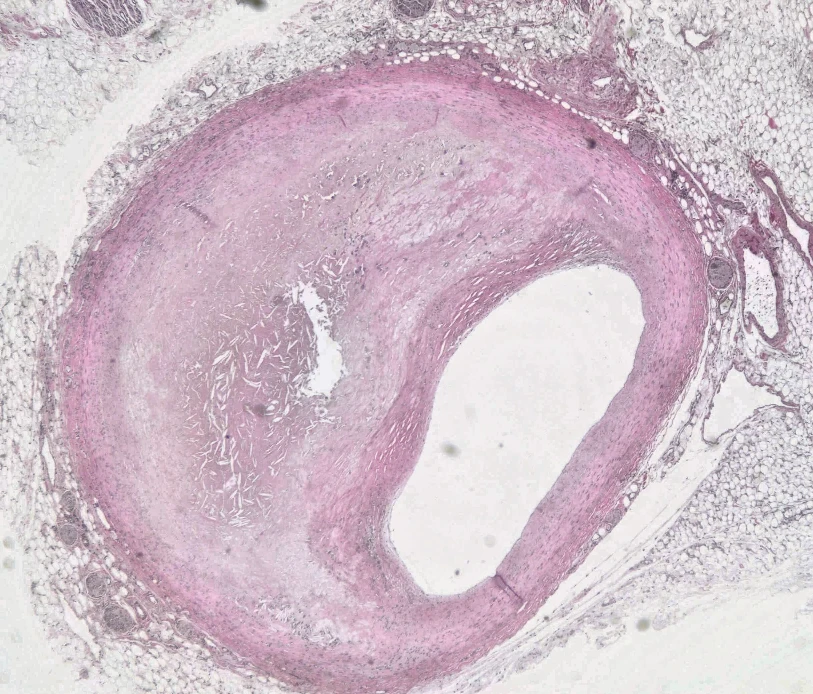
- Take a photomicrograph. I’ve been through how I do that. I have a camera set up on my scope, so it’s not much of a hassle. Here’s an example, after division with a brightfield section:

- I now load it into my favorite open source scientific image analysis package, ImageJ/Fiji ( https://fiji.sc/ ). This pic is a little low on contrast and a bit washed out, so I’ll do a quick contrast enhancement to make it easier to see details, using the contrast limited adaptive histogram equalization method (CLAHE). In Fiji, you click on Process-> Enhance Local Contrast (CLAHE). For this I’ll use the default parameters, since I really don’t care:

- Now, I’ll choose the polygon tool: .

- And enclose what the artery should look like without plaque. In the contrast-enhanced image, you can see the muscularis:

- Now, I choose Analyze->Measure, and Fiji provides the Area enclosed by the polygon, 2067360 pixels:

- Now, I choose Edit- Selection-> Select None to clear the polygon, and create another polygon that just has the lumen: .

- I get the area of that polygon in the same way as step 6: .

- Now, I just divide the second number by the first, to get 410121/2067360 = 0.1983, or 80% stenosis.
In my report, I can then write “Examination of the right coronary artery reveals 80% atherosclerotic stenosis by morphometry.” That gives me warm fuzzies.
Update: Someone asked me if I thought everybody should do this routinely. Nope, not at all. I do this because I like photomicrography, image processing, and like to quantify things. I do this because it amuses me. Frankly, noticing that a plaque is big enough to be a risk for sudden death isn’t rocket surgery. If you’ve been through fellowship, you can do it. Your sampling technique may mean that you *miss* some lesions, but if you see it, you can tell grossly whether or not it was life-threatening. I don’t even think that you need to do gross photographs of it. If some moron thinks you are lying about it, then they will think you are faking the photo. Screw them. I like the idea of doing this, and I think it makes my reports marginally better, but I don’t think it should be a standard.