So, I’m playing around with ChatGPT. Since the recent church shootings resulted in libs pulling out their constant bete noir, of gun control, I thought I’d see if I could get it to chart number of guns in circulation versus homicide rate. It was interesting that ChatGPT could not download and analyze CDC WONDER data, so instead it had me download it and then upload it to ChatGPT for the graph.
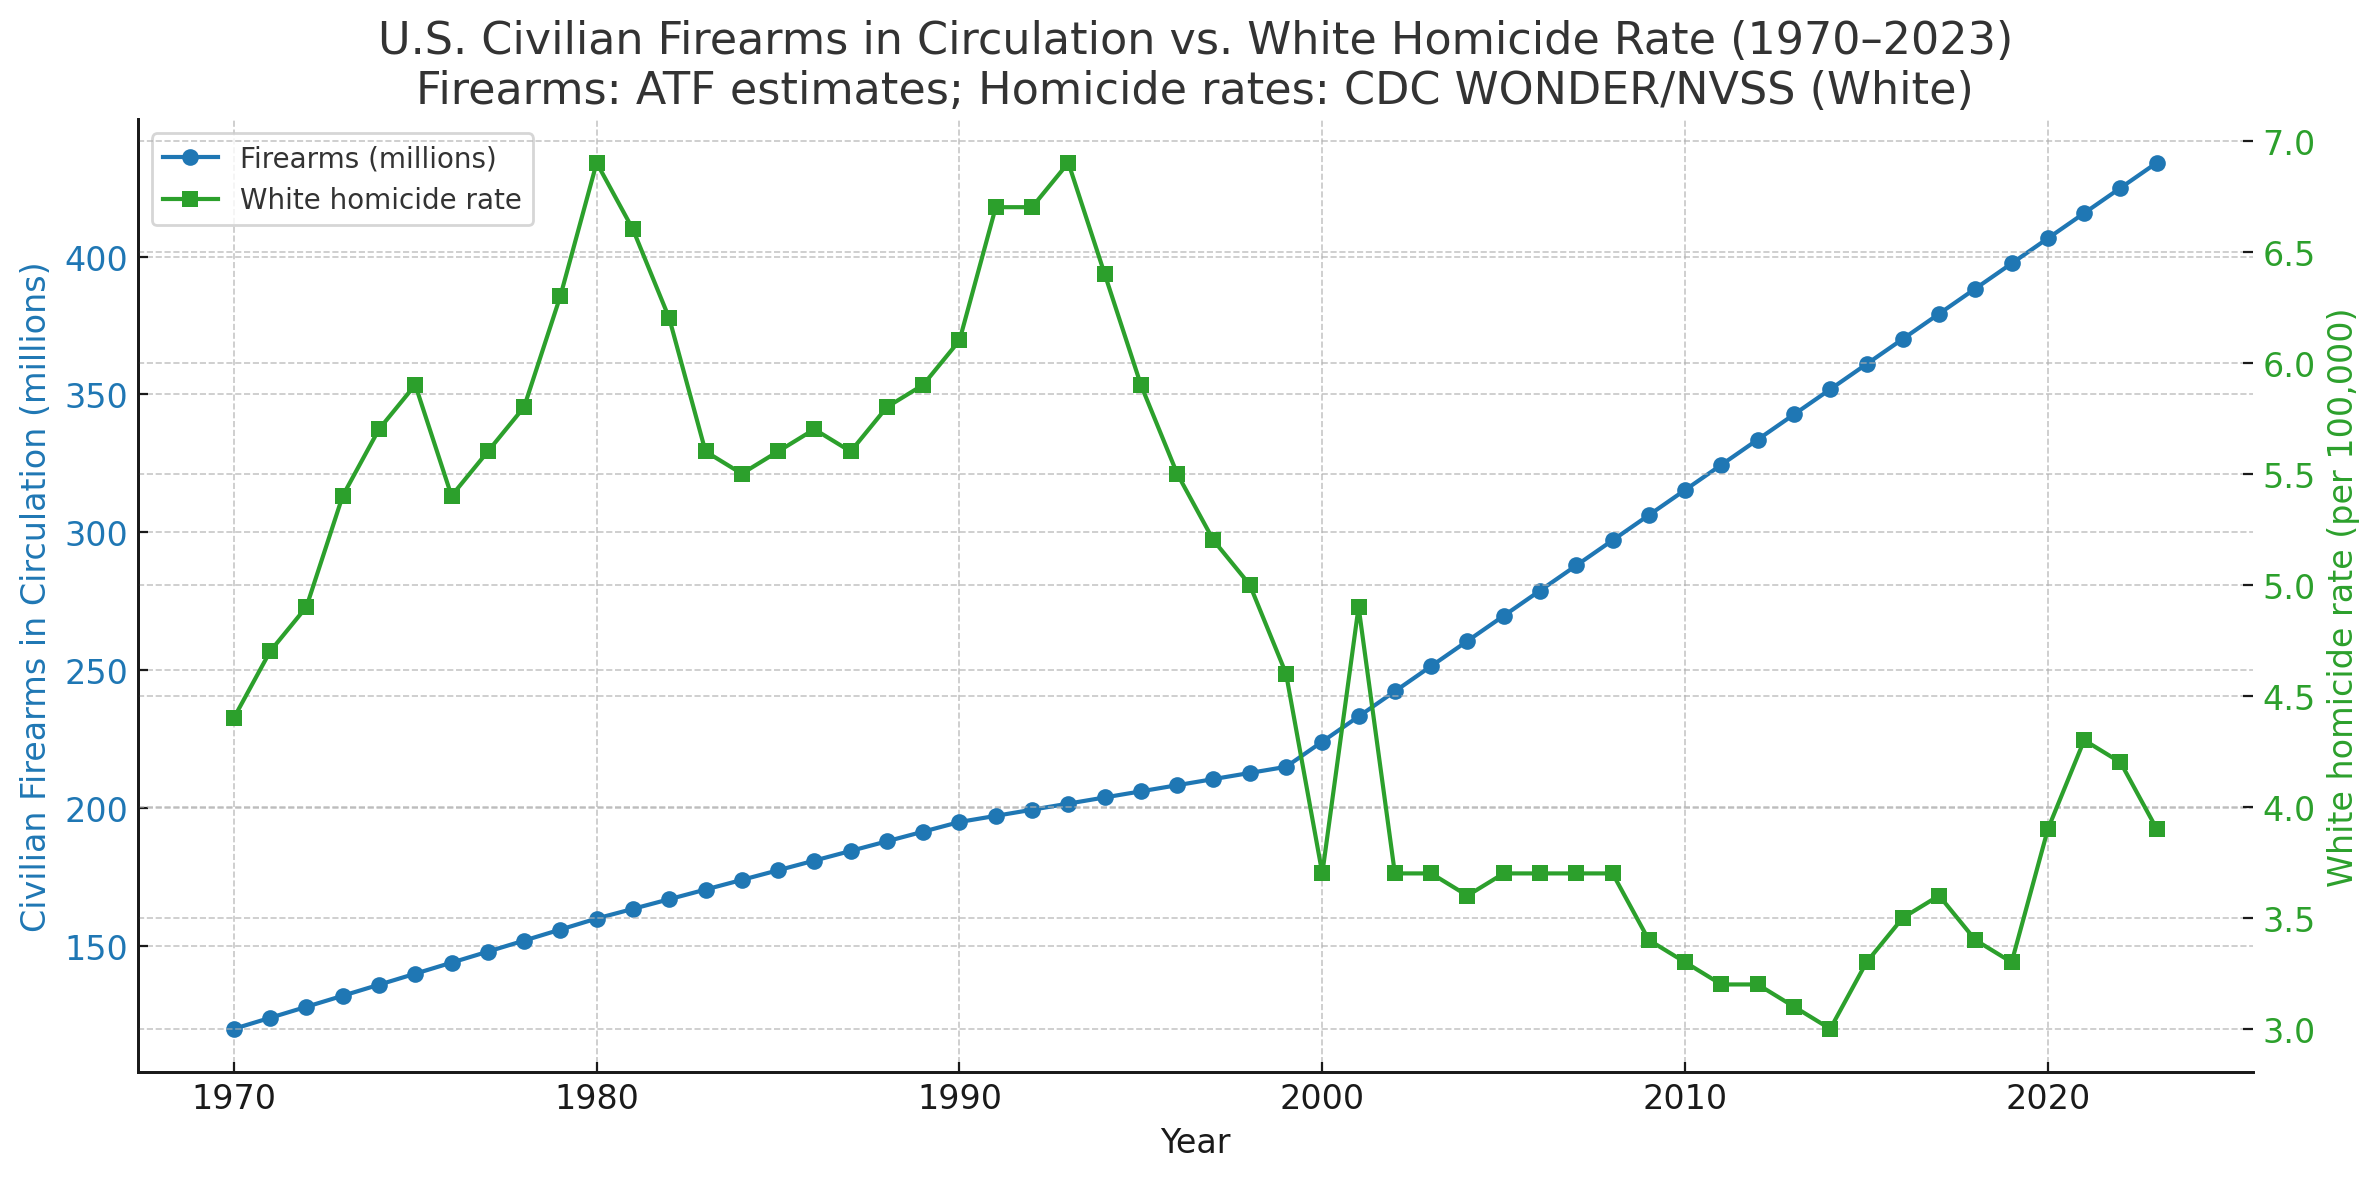
Here it is:Please recreate the graph, but only include whie homicide rate.
Three points shout out.
First, there’s obviously no visual positive correlation between number of guns and homicide rates. In fact it’s negative The calculated correlation coefficients are
-
White: –0.75
-
Black: –0.69
-
Hispanic: –0.33
Hmmm…. now, in most studies, an r of -.75 would be pretty spectacular. But, to the progs, it means the opposite of what one might reasonably infer.
Second, “something” happened in 2020, and it wasn’t a surge in number of guns. Any ideas? Maybe some stunningly totalitarian policies promoted by the progs?
Third, one has to wonder why the progs are sold that the “solution” is to take guns from the people in the green line…
Update:
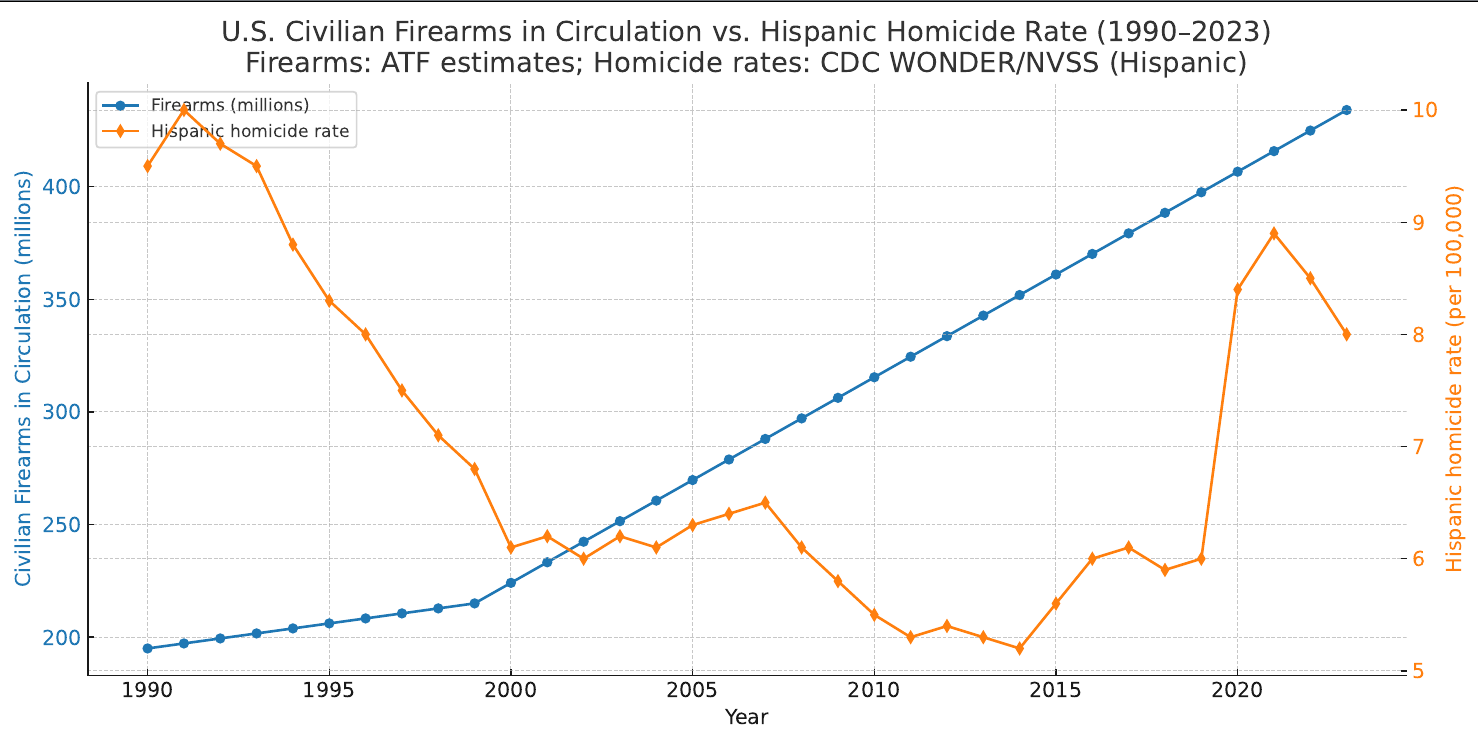
In response to a comment from a colleague, I’ll point out that the Hispanic and White graphs have their own variability, you just can’t see them because the African American data sets the scale. Here is the White data with the homicide rate scaled from 3 to 7 rather than 3 to 45.
And for Hispanics:
It’s impressive how you can “prove almost anything in data like this with a well-chosen short time sample. The classic were the claims that the “assault weapon” ban of the 1990s “caused” a decrease in death. It didn’t, of course. The real cause? Few people know. It was the decline in atmospheric lead. It turns out that there is a big correlation between atmospheric lead concentration and viiolent crime, with a 22 year delay. Lead in gas was outlawed in the late 60s and early 70s, so crime dropped in the 90s. Here’s an example for New Orleans:
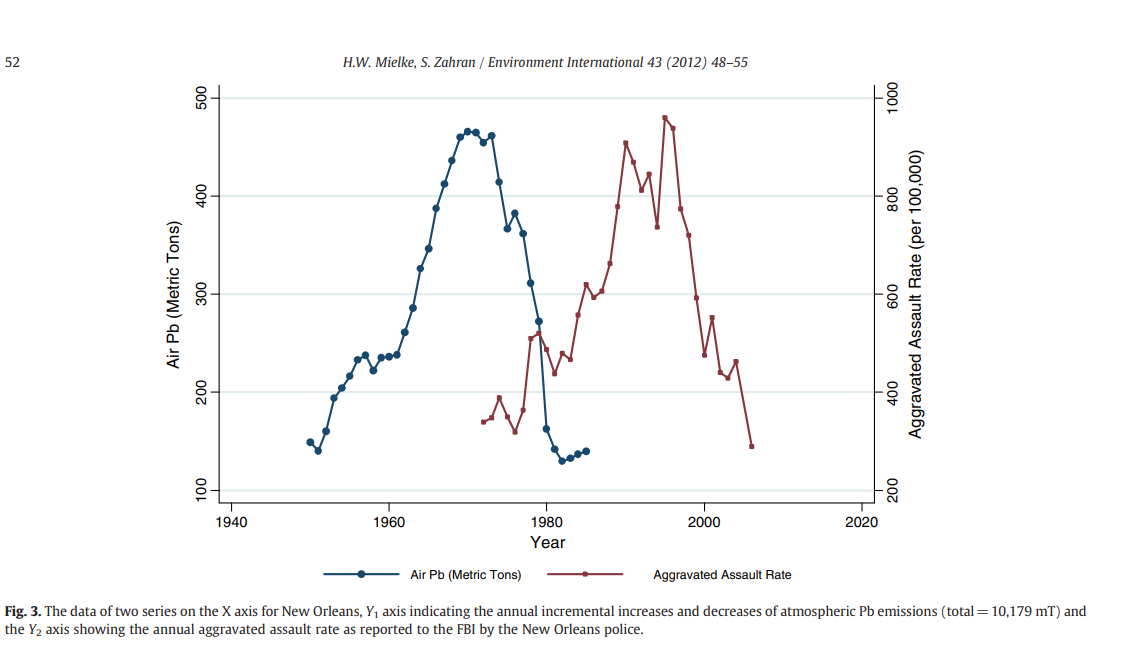
Mielke, H.W. and Zahran, S., 2012. The urban rise and fall of air lead (Pb) and the latent surge and retreat of societal violence. Environment international, 43, pp.48-55.